We'll look at it in the article.
Current ratio. Balance calculation formula
Current ratio (English Current ratio) is the ratio of highly liquid assets, quickly realizable assets and slowly convertible assets to the most urgent liabilities and medium-term liabilities. This indicator is one of the three main criteria characterizing the liquidity of an enterprise. Liquidity, as a rule, is equated to the solvency and ability of an enterprise (firm, company) to sell assets at a market price. The concept of liquidity comes from the term liquidate, that is, sell. Liquidity is one of the key concepts of financial analysis and shows the rate at which assets are converted into money.
Below is a classification of the types of assets and liabilities of an enterprise used to assess liquidity.
A1 = Highly liquid assets (line 1250)
A2 = Quickly realizable assets (line 1230)
A3 = Slowly convertible assets (line 1220)
—————————————————————
P1 = Most urgent obligations (p. 1520)
P2 = Medium-term liabilities (line 1510)
As a result, the analytical formula for assessing current liquidity has the following form:
Calculation of the current ratio using the new balance sheet form
The new balance was adopted in 2011, the main differences are in the names of the lines, and not in the economic sense of the formula.
Current ratio= p.1200 / p.1510+p.1520+p.1550
Calculation of the current ratio using the old balance sheet form
There are two options for calculating using the old formula for this indicator.
Current ratio= (p. 290 Form No. 1) / (p. 610+ p. 620 + p. 630 + p. 640+ p. 660);
Current ratio= (p.290-p.230 Form No. 1) / p.690.
Current ratio standard
If the current ratio is greater than 2, this indicates that the company has more current assets than short-term liabilities with double coverage. An enterprise (company) has a high ability to pay off its obligations (debts) in the short term. The standard value of current liquidity equal to 2 was obtained in practice and is most often found in domestic regulations.
In world practice, the optimal coefficient is considered to be in the range from 1.5 to 2.5. If the current liquidity ratio is less than 1, then the enterprise cannot reliably pay off short-term obligations. The table below presents a comparison of domestic and international standards and the level of solvency of the enterprise.
| Valuesindicator | Standards | |
| Russian | International | |
| <1 | Critical solvency | |
| 1,5-2 | Low solvency | |
| 2-3 | Satisfactory solvency | |
| >3 | High solvency / Possible irrational capital structure | |
Current ratio in infographic
The figure below infographics shows the key features of the current ratio, directions of use, calculation formula and assessment of the indicator.

Click to enlarge
Video lesson: “An example of calculating liquidity ratios for OJSC Gazprom”
Comparison of current ratio with other liquidity indicators
In addition to the current ratio, in the practice of financial analysis, the quick ratio and the absolute ratio are often used. They show the ability of an enterprise to repay its debt obligations with quickly realizable and highly liquid types of assets.
Thus, the absolute liquidity ratio shows the ability of an enterprise to pay off its debts using the most liquid assets (cash and short-term financial investments). That is, this indicator shows the maximum speed with which a company can pay off creditors (and other borrowers).
The quick liquidity ratio shows the ability of an enterprise to pay off its debts using not only highly liquid assets, but also quickly realizable ones - these are short-term receivables.
How to calculate the current ratio for an industry?
The standard values are also influenced by the industry average values of the current ratio. We present an algorithm for calculating the current liquidity indicator for any industry.
Different industries may have different ratio values. To calculate industry average values, OKVED codes (Classifier of Activities) are used. They group enterprises engaged in the same type of activity, calculate their coefficient values and average them.
For example, let's take enterprises in the oil and gas industry, enterprises will have the following types of activities.
In addition to selecting enterprises using a single OKVED code, you should also select companies by size; for this we use the “Volume of sales revenue” indicator. This is done in order to make the sample for analysis as homogeneous as possible.
The formula for calculating the current ratio for an industry is as follows:
Industry current ratio= Current liquidity ratios of the enterprise (according to one OKVED code and Volume of revenue) / Number of enterprises
For all similar enterprises based on the selected OKVED code and size, the current liquidity ratio is calculated and the arithmetic average is performed. The information system for data analysis – SPARK – is ideal for carrying out such analysis. To improve accuracy, you can assign different weights to different groups of enterprises.
An example of analysis of the current ratio for JSC Transneft and the industry
The current liquidity ratio for 2009 for Transneft OJSC is 3.48, which is quite high according to general standards. Let's compare the enterprise with similar enterprises having a similar type of activity and size.
Type of activity of Transneft OJSC - Oil and gas industry, Petroleum products - sales, transportation, Oil and gas - production. For JSC Transneft, sales revenue exceeds 1000 million rubles. The final calculation of the industry average value of the indicator is presented in the table below.
The current liquidity value for similar enterprises was calculated and amounted to 2.76. As we can see, Transneft OJSC has a higher solvency in relation to the industry average. This indicates the good financial condition of this company.
An example of comparing the current ratio of an enterprise with its industry
In addition to comparing with the industry average value of the current liquidity indicator, you can compare it with the indicator for a selected region, for example, Moscow, as one of the leading regions of Russia.
Forecasting the current ratio
A point calculation of the current liquidity ratio cannot fully characterize the state of the enterprise. Therefore, it is necessary to analyze the dynamics of changes in the indicator over several reporting periods. This allows us to predict its further changes. The figure below shows the dynamics of changes in the current liquidity ratio and makes a forecast based on linear regression.
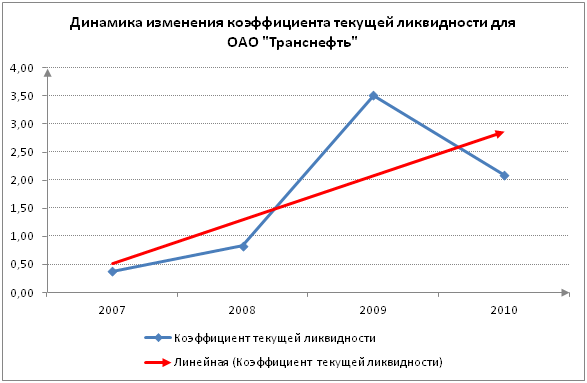
Dynamics of changes in the current liquidity ratio for Transneft JSC
As we can see, there is an increasing trend in changes in the current liquidity ratio. This indicates favorable programs for the financial rehabilitation of the enterprise, when in 2007 the indicator was less than 0.5, which does not correspond to the standards, whereas in 2010 it was higher than the standard value (equal to 2.1).
How to increase your current ratio
As we found out, the current liquidity ratio characterizes the financial condition of the enterprise and is used by many credit institutions to assess the solvency of the company. Increasing the solvency of an enterprise leads to a decrease in the cost of borrowed capital (interest rates on loans), and therefore allows an increase in the net profit and profitability of the company.
Let's look at several ways to increase the coefficient:
- Reducing the volume of accounts payable due to its restructuring through netting or writing off as unclaimed.
- Increase in current assets.
- Increase in current assets and at the same time reduce accounts payable.
Summary
The current liquidity ratio is an important indicator of the financial condition of an enterprise/company, which must always be monitored. An increase in the indicator makes the enterprise more attractive for investors and creditors, which can give it more additional leverage and financial resources to increase its value in the market and profitability.
The liquidity indicator is one of the most important economic parameters for any type of business, and its correct assessment can often save a company from collapse, especially during market fluctuations.
What it is?
Dear readers! The article talks about typical ways to resolve legal issues, but each case is individual. If you want to know how solve exactly your problem- contact a consultant:
APPLICATIONS AND CALLS ARE ACCEPTED 24/7 and 7 days a week.
It's fast and FOR FREE!
In order for a business to develop and generate income, the financial analysis department must constantly monitor many different parameters, including liquidity. At the same time, in addition to the current one, 2 more types of it are considered: fast and .
What does it show and characterize?
The current liquidity ratio characterizes how quickly a company can get rid of working capital at or close to the market price.
Mathematically, it is defined as the ratio of assets in circulation to liabilities, and if translated literally, in Latin “liquidity” means the ability to leak or fluidity.
This name was not chosen by chance - they talk about liquidity when it is necessary to “merge” assets in a short time in order to attract new investments.
What is it measured in?
The liquidity ratio is a dimensionless quantity and is measured either as a percentage or in classical form as a decimal fraction.
In what cases is it required?
Analysts are always required to keep their superiors informed of key financial indicators. But good liquidity indicators can be extremely beneficial in the moments preceding a market fall.
Example:
Individual entrepreneur Alekseev purchased several apartments with a mortgage in a building not far from which a plant was being built. His asset was real estate, or more precisely, its market value, while his liability was debt obligations to the bank. These apartments were in demand, and IP Alekseev could quickly sell them at the market price and even higher.
However, soon the construction of the plant was stopped and the increase in real estate values gave way to a fall, so it became impossible to quickly “merge” assets at the market price.
In terms of financial analysis, it is said that current liquidity was high at first and then fell.
Factors influencing the dynamics of the indicator
Thus, it turns out that the higher the demand for assets by industry, the higher the current liquidity, and the more liabilities a company has, the lower it is, accordingly.
How to calculate the current ratio?
Mathematically, current liquidity is calculated as follows: the debts of the founders are subtracted from the total amount of working capital, and the resulting difference is divided by debt obligations.
As a result, since rubles are divided into rubles, the result is dimensionless.
Formula
The formula in literal form looks like this:
By balance
Once a year, the current liquidity ratio is necessarily calculated from the balance sheet, in which the necessary data can be found in the corresponding lines.
The formula in this case looks like this:

What documents will be required for calculation?
When determining the ratio through accounting, you will only need a balance sheet, and to calculate current liquidity in mathematical form, you will need all the papers that include the income, expenses and debt obligations of the organization.
It can be:
- contract of sale;
- employment contract with employees;
- mortgage agreement or promissory note.
Interpretation of the result
Sometimes the life of an enterprise can depend on the correct interpretation of the amount of current liquidity, so the company must have a competent financial department that can track the slightest fluctuations in a timely manner.
Norm value
Normally, with an optimal ratio of assets and liabilities, the coefficient should be equal to 2 - 2.5.
This means that the funds in circulation are twice as much as the organization owes (to third-party firms or employees), and in the event of a sudden market fluctuation, the liquidation of assets will be painless.
If above normal
If the liquidity value is high, in particular, above 3, this is not bad, but in practice such a ratio is extremely rare.
After all, if 3 times more funds are involved in turnover than are in liabilities, this means that the assets are too in demand, and the company receives less profit than it could.
In this case, part of them is sold at a price higher than the market price (high liquidity allows this), and the funds received are used to purchase less in demand assets, but in larger quantities.
If less than the standard value
When liquidity falls below 2, but there is still more than one left, this means that it is time to worry, at a minimum, about selling assets on time, without waiting for a complete collapse, or to stimulate the work of marketers.
A competent analytical department can predict the behavior of the market in advance, and if there is a recovery after a recession, it will be able to use this instability to the benefit of the company.
However, if the current ratio becomes less than 1, the risk increases significantly.
As a rule, sharp jumps in the indicator from bottom to top occur very rarely, which means a high probability of collapse.
If it has increased, what does it mean?
Let's look at increasing current liquidity using an example:
Individual entrepreneur Ivanov acquired an asset - a carpentry workshop, the liquidity of which at the time of purchase was equal to 2. Soon the fashion for wooden furniture gained momentum, and along with it, demand also grew.
In this case, the number of workshops will increase until supply and demand are balanced, and until then the value of Ivanov’s asset will be higher than the original one. During this period of time, it is profitable for him to sell his organization, and after prices level out, buy two or more.
What does the decrease mean?
In an example, a decrease in liquidity looks like this:
Farmer Petrov raised cows to sell milk. In this case, the cows were his asset, and in general, the enterprise was liquid, since milk is a fairly valuable product.
But over time, a milk factory appeared in the area, which could sell its products at a lower price. Then the value of Petrov’s asset decreased, and the enterprise as a whole began to operate at a loss.
If Petrov had been able to predict the construction of the dairy factory before the farm's liquidity became less than normal, he could have sold it and bought a more profitable asset, and the less prudent buyer would have suffered the loss.
Ways of adjustment
There are two ways to adjust liquidity: by asset and by liability:
- If the value of an asset has decreased, it should be normalized either by improving product quality or through marketing moves.
- If liabilities have increased, it is necessary to take timely measures and reduce the requirements for personnel qualifications so that it is possible to reduce employee salaries.
Practical calculation example
A potato chip company purchased $3 million worth of potatoes during the previous year. The cost of the finished product was 5 million, so the revenue or turnover amounted to 1.5 million dollars, and then 500 thousand of this money went into debt on the authorized capital.
Liabilities are funds allocated for workers' salaries - 300 thousand and for equipment rental - 200 thousand.
Then:
The resulting coefficient indicates a fairly high demand for the plant, which means that competing plants will appear in the future.
Liquidity ratiocharacterizes the ability of a legal entity to pay its debts with its own property. Let's look at what options for calculating the liquidity ratio exist in our article.
Enterprise liquidity: from absolute to total
The concept of liquidity (i.e., the ability to be sold) applies to the property that constitutes the current assets of an enterprise. It is considered in connection with a quantitative assessment of the possibility of repaying the short-term debts of the enterprise.
Based on the speed of sale, property forming current assets is divided into liquidated assets:
- very quickly (money and short-term financial investments);
- quickly enough (short-term accounts receivable);
- relatively short-lived (reserves).
In accordance with this gradation, 3 main liquidity ratios are calculated:
- absolute (based on the value of the property being sold very quickly);
- average (from the amount of property sold very quickly and fairly quickly);
- total (of the total value of all current assets).
The meaning of these ratios is to compare the value of available property and the amount of short-term debts existing on the same date. That is, each liquidity ratio shows what part of short-term liabilities can be repaid through the sale of each set of types of property.
Since the type of property is linked to the speed of its sale, the calculated coefficients give an idea of the company’s ability to pay off debts in a time-bound manner. And this, in turn, allows us to draw conclusions about the current solvency of the enterprise, analyze its dynamics in retrospect and make forecasts for the future.
How to calculate liquidity ratios
The procedure for calculating liquidity ratios is subject to 1 algorithm: each of them represents the ratio of the value of the corresponding property to the amount of short-term debts. The data for calculation is taken from the sections of the balance sheet.
The value of short-term debts can be determined as a result of Section V, provided that the values of the data for deferred income and estimated liabilities, which are not actually debt, are immaterial. Otherwise, as the denominator liquidity ratios It is better to use the amount of liabilities for borrowed funds and all (ordinary and other) debts to creditors taken along the lines of this section.
In relation to the 2nd option, the denominator of the coefficient formula will look like this:
KLabs = (DenSr + KrFinVl) / (KrKr + KrKredZad + PrObligation),
KLsr = (DenSr + KrFinVl + KrDebZad) / (KrKr + KrKredZad + ProObligation),
CLtotal = OborAct / (KrKred + KrKredAsad + ProObligation),
The following ratio is often used as a formula for the total liquidity ratio:
CLtotal = OborAkt / KrObliaz,
OborAct - the total value of the value of current assets;
KrOliaz - the general value of the amount of short-term liabilities.
Liquidity ratios: balance sheet formulas
If we express the formulas for liquidity ratios through the line numbers of the current balance sheet, they will take the following form:
- absolute liquidity ratio:
KLabs = (1250 + 1240) / (1510 + 1520 + 1550),
- urgent liquidity ratio:
KLsr = (1250 + 1240 + 1230) / (1510 + 1520 + 1550),
- total liquidity ratio:
CLtotal = 1200 / (1510 + 1520 + 1550),
where: KLabs - absolute liquidity ratio;
KLsr—term liquidity ratio;
KLtot - total liquidity ratio;
DenSr - amount of funds;
KrFinVl - the amount of short-term financial investments;
KrDebZad - short-term debts of debtors;
OborAct - the total amount of current assets;
KrKred - the amount of short-term borrowed funds;
KrKedrZad - short-term debts to creditors;
Obligation - the amount of other short-term debts.
And the 2nd calculation of the total liquidity ratio will look like this:
CLtotal = 1200 / 1500,
where: KLtot - total liquidity ratio;
1200 - the total value of current assets;
1500 is the total value of short-term liabilities.
What do the standard values of the coefficients show?
The following are considered the standard values of the considered coefficients:
- For absolute liquidity - in the range of 0.2-0.5, which indicates the ability to very quickly repay from 20 to 50% of short-term debts.
- For urgent liquidity - in the range of 0.7-1, i.e. when you can quickly close from 70 to 100% of short-term debts.
- For overall liquidity, it is equal to or greater (but not much) 1, i.e. current assets must cover the amount of short-term liabilities. A coefficient value significantly exceeding 1 indicates ineffective use of working capital.
In the article we will analyze the main solvency ratios of an enterprise and the formulas for their calculation.
Solvency of the enterprise. Definition
Solvency is the ability of an enterprise to repay its obligations to borrowers in a timely manner and in full. Solvency determines the financial condition, as a result, a decrease in the level of solvency leads to an increase in the risk of bankruptcy of the enterprise. To assess the financial condition, solvency ratios are used, which provide a quantitative characteristic of the enterprise.
To repay its obligations (loans), an enterprise can use both cash and various types of assets that have varying degrees of liquidity. Thus, the solvency of an enterprise is formed due to two factors:
- the presence of assets of the enterprise of various types;
- the level of liquidity of assets, which is determined by the degree of their realizability.
Enterprise asset structure
Let's consider the structure of the enterprise's assets, which consists of current and permanent assets. Current assets of the enterprise– these are assets that can be converted into cash within one production cycle (1 year). Permanent assets consist of fixed assets of production and are not directly involved in production. All assets of the enterprise are ranked according to the degree of liquidity, i.e. depending on the speed of their implementation (sale) and transformation into cash. The more highly liquid assets an enterprise has, the higher its solvency. Ranking of assets by speed of implementation:
Highly liquid liquid assets (A1)
Highly liquid assets enterprises form a group of current assets and have the maximum speed of implementation and their transformation into cash. The most liquid assets include: cash on hand, short-term financial investments in the bank and securities.
Quickly realizable assets (A2)
Quickly realizable enterprise assets belong to the group of current assets and include accounts receivable (<12 месяцев) и вклады в банк.
Slowly selling assets (A3)
Slow moving assets are included in the group of current assets of the enterprise and include: accounts receivable (> 12 months), inventories of finished products, raw materials, unfinished products and semi-finished products, VAT on acquired value.
Hard to sell assets (A4)
Hard to sell assets are permanent assets of the enterprise and include: buildings and structures, equipment, transport, land, intangible assets: patents, trademarks.
The difference between solvency and the creditworthiness of an enterprise
The concept of an enterprise's solvency is closely related to its creditworthiness. Let's take a closer look at their differences. The main difference is that solvency is the ability to pay off one’s obligations using any type of assets. Creditworthiness reflects to a greater extent the repayment of obligations with the help of medium-term and short-term assets of the enterprise, excluding permanent assets: buildings, structures, vehicles, land, etc. Paying off liabilities with the help of permanent and slowly selling assets leads to a decrease in production capacity, and, consequently, a decrease in financial stability in the long term.
Enterprise solvency ratios
To assess the solvency of an enterprise, the following indicators are used:
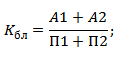
Current ratio– reflects the ability of an enterprise to pay off its current obligations using current assets. The calculation formula is as follows:

(analogue: urgent liquidity) – shows the possibility of repaying short-term liabilities with the help of quick-liquid and highly liquid assets. The calculation formula is as follows:
The standard value for the quick liquidity ratio Kbl is >0.7-0.8.
Absolute liquidity ratio– reflects the ability of an enterprise to pay off its short-term obligations with the help of highly liquid assets. The indicator is calculated using the formula:

The standard value for Kabl is >0.2.
– shows the ability of the enterprise to pay off its obligations in full with all types of assets. This indicator includes not only short-term but also long-term liabilities. The calculation formula is the ratio of the weighted sum of assets and liabilities.

If the overall liquidity indicator K o l >1 – the liquidity level is optimal.
The Law “On Insolvency (Bankruptcy)” identifies three coefficients that are used to assess the solvency of an enterprise: the current liquidity ratio, the coefficient of restoration of solvency and the coefficient of loss of solvency. These indicators are currently used in practice as information indicators.
– reflects the enterprise’s ability to restore an acceptable level of current liquidity within 6 months. The formula for calculating the solvency recovery ratio is as follows:

K vp – coefficient of restoration of solvency of the enterprise;
The standard value of the indicator is considered to be Kvp > 1 - reflects the ability of the enterprise to restore the level of solvency within 6 months. If K VP<1 – предприятие не располагает ресурсами для восстановления платежеспособности в течение 6-ти месяцев. К тому же, данный коэффициент строится на анализе тренда по двух периодам, что не является достаточно точным прогнозом динамики платежеспособности.
Loss of solvency ratio– reflects the possibility of a deterioration in the solvency of the enterprise within 3 months. The formula for calculating this indicator is as follows:

K unit – coefficient of loss of solvency of the enterprise;
K tl – current liquidity ratio at the beginning (0) and at the end (1) of the reporting period;
K norms – standard value of the current liquidity ratio (K norms = 2);
T – analyzed reporting period.
Standard coefficient of loss of solvency K p > 1 – the degree of threat of loss of solvency within 3 months is small. K pack< 1 – предприятие может потерять платежеспособность в течение 3-х месяцев. Коэффициент утраты платежеспособности аналогичен коэффициенту восстановления платежеспособности и показывает динамику изменения коэффициента текущей ликвидности предприятия по двум периодам. Это является его существенным недостатком, так как точность оценки направления тренда по двум данным низка.
Summary
In this article, we examined various enterprise solvency ratios and formulas for their calculation. An enterprise needs to quickly monitor the level of its solvency, since it directly determines its financial condition and the sustainability of long-term development. In addition to liquidity ratios, solvency is influenced by the coefficients of capital structure, profitability and turnover, so an enterprise needs to have a system for assessing and diagnosing its financial condition.
In this article we will look at the current ratio, which shows the company’s ability to pay off current (short-term) obligations using only current assets.
Thanks to its simple calculation formula and information content, the current liquidity ratio has an important place in assessing the financial performance of various industries and is used in a number of effective methods for predicting bankruptcy.
Current ratio. general information
Current (or total) liquidity ratio (k) is a financial value showing the ratio of current assets to current liabilities, or short-term liabilities, which is compiled on the basis of balance sheet information. It is also an indicator of the ability to repay short-term loans using working capital. The higher k is, the more solvent the company is. Its decrease indicates that assets are no longer urgently sold. General formula:
- k = (current assets) : (current liabilities).
Current assets:
- cash (including electronic money) at the cash desk, in bank accounts;
- accounts receivable + provision for bad debts;
- investments in securities;
- material assets and products for sale.
Current responsibility:
- loans for up to one year;
- unpaid obligations to suppliers and the treasury.
- other loans.
Deduction formula for assets and liabilities:
- k = (Al + Ab + Am) : (Ps + Pk), where
- Al – Liquid assets;
- Ab – quickly sold;
- Am – slowly being realized;
- Ps – Liabilities of fixed-term obligations;
- PC – short-term.
Balance formula:
- k = (p. 1200 + p. 1170) : (p. 1500 – p. 1530) – p. 1540).
Purpose of the total liquidity ratio
This value performs the following tasks:
- an indicator of the ability to pay off its obligations during the current production cycle;
- “litmus test” of the company’s solvency, its ability to cover all loans with available amounts;
- efficiency indicator of both a separate operating period and the chosen direction of product turnover;
- important information for investors;
- the components necessary for the formula for a given k are also used when calculating working capital.
Current ratio norm and deviations from it
Current ratio value:
| Short | Norm | High |
| < 1,5 | 1,5 -2,5 | > 2,5 |
| Difficulties in fulfilling obligations - the consequence should be the closure of accounts payable and a decrease in current assets, since the company will not be able to pay its obligations at this moment. However, such budget instability does not always lead to bankruptcy of the company | Illustrates how many rubles of current assets there are per ruble of current liabilities. Theoretically, such an enterprise will be able to meet its obligations in a timely manner at any time. | Current assets and goods are not used at the proper level - the availability of short-term loans should be expanded |
Important! When calculating, we must not forget that assets are unevenly liquid - it is necessary to take into account in detail the speed of their turnover (use the second formula).
Ways to increase the liquidity of an enterprise
To optimize k indicators, the following methods are used:
| Way | Actions | pros | Minuses |
| Increasing the profitability of core activities, keeping most of the income at your disposal | Dividend cut Reducing funding for non-productive purposes | Quickly bringing k into the normal range | Negative impact on the company’s image, trust of founders, shareholders |
| Reducing the number of projects whose source of financing is short-term capital | Reducing the amount of investments in construction, reconstruction, and purchase of expensive equipment | The company stops investing amounts exceeding its financial capabilities | Reflection on the level of compliance with international standards for equipment and conditions of production and other activities |
| Limitation of financing through short-term loans | Using short-term debt only to replenish working capital; a multi-year loan is used to cover other expenses | Investment of long-term programs is carried out using a long-term loan and current income | The emergence of new loan obligations |
| Changes in money management principles | Programs to improve the efficiency of working capital management | General modernization of business methods | Suitable only for companies whose increase in working capital is due to financing through short-term loans |
| Debt restructuring to creditors | Offsetting and subsequent write-off in the form of unclaimed amount | Getting rid of overwhelming debt | Complex, trust-breaking process |
Important! Shortk True liquidity is not an indicator of a company's cash shortage. Since current assets include receivables, investments, products, etc.
Calculation of the indicator using the example of AVTOVAZ
| Index | year 2014 | 2015 | 2016 |
| Working capital | 49 783 | 40 073 | 55 807 |
| Short-term loans | 86 888 | 112 867 | 117 723 |
Using the general formula:
- k (2014) = 49,783/ 86,888 = 0.00001151;
- k(2015) = 40,073/112,867 = 0.00000886;
- k (2016) = 55,807/117,723 = 0.4740535.
Average current liquidity indicator by industry of the Russian Federation
| 2013 | 2014 | 2015 | 2016 | 2017 | |
| Agriculture | 1,7644 | 1,7437 | 1,7678 | 1,7651 | 1,862 |
| Construction | 1,327 | 1,2474 | 1,2069 | 1,251 | 1,243 |
| Oil and gas industry | 1,8771 | 1,7718 | 1,8343 | 1,7849 | 2,3887 |
| Trade enterprises | 1,6426 | 1,6931 | 1,658 | 1,7146 | 1,6006 |
| Industry (metallurgy) | 1,5689 | 1,5572 | 1,5297 | 1,592 | 1,5261 |
| Small business (hotel, restaurant service) | 1,4887 | 1,1795 | 1,2726 | 1,5998 | 1,2305 |
| General indicators for the country | 1,7143 | 1,6764 | 1,5012 | 1,5389 | 1,4903 |
Comparison with other liquidity ratios
Comparative table of existing liquidity deduction ratios:
| kabsolute liquidity | ktotal liquidity (current) | kquick liquidity | |
| Essence | Analyzes liquidity by calculating k between the company's total budget, its equivalent and current loans | Possibility to repay short-term debt using working capital | The ability to repay a loan using your fastest cashable assets, for example, in case of sudden difficulties in selling the company's goods. Indicator of financial stability |
| Peculiarities | Credit profile of the company. Does not take into account debts of debtors, inventories of goods and unsold products - only monetary assets available at the moment. Evaluates the current ability to respond to your loans | General information about solvency, including its assessment for one production period. Data on the ability to cash out your products. Indicators for its calculation can be used in the formula that subtracts working capital | It is somewhat similar to deducting k total liquidity, but shifts the focus to a narrower area, excluding inventories - the slowest liquidity part of assets. In assessing solvency, the method is more conservative and cautious |
| Calculation formula | K= ((monetary assets) + (short-term investments)) : (short loans) | K = (current assets) : (current loans) | K = ((monetary assets) + (short-term investments) + (debts of debtors)) : (current short-term liabilities) |
| Normal values | <0,2 – неимение возможности ответить по обязательствам при помощи только оборотных средств; 0.2 – 0.5 – normal solvency; >0.5 – unclaimed monetary assets in banks, irrational investments | <1,5 – трудности в покрытии долгов; 1.5-2.5 – solvency is normal; >2.5 – irrational distribution of assets, infringement in the financing of any industries | 0.7-1 is the norm; loans taken and provided by the company are approximately equivalent. Below 0.7 – there is a possibility of a shortage of liquid quantities. More than 1: the company’s desire to provide loans to debtors in larger quantities than acquiring such obligations for itself |
| Application | Calculation is necessary for future suppliers who require payment using term loans | The indicators of this k are of greater interest to investors | Wide range: for managers – assessment of the company’s financial performance; for creditors – checking the financial stability of the enterprise and the risks associated with it; for investors - forecast of return on investment |
Important! The norms of the coefficients may vary depending on the industry of the enterprise.
Using the current ratio in predicting bankruptcy
The current liquidity ratio is one of the values that allows you to calculate the state of affairs of a company in the future - bankruptcy or prosperous activity. When making calculations, Edward Malton’s formula is often used:
- B = – 0.3877 – 1.0736 x k l + 0.0579 x k n. (k l – current liquidity ratio, k n – concentration of hired funds):
- B > 0 – the probability of bankruptcy is low;
- B = 0 – 50/50;
- IN< 0 – чем выше величина, тем вероятнее разорение.
The advantage of the formula is its simplicity. However, it is not adapted for Russian business, since it was created using the example of reporting in foreign countries, so there is a possibility of forecast error. A more accurate formula is the so-called four-phase, but with different components:
- B = (8.38 x A 1) + A 2 + (0.054 x A 3) + (0.63 x A 4), where
- A 1 – working capital/asset;
- A 2 – net income/own budget;
- A 3 – profit from the sale of products/asset;
- A 4 – net revenue/integral expenses.
Important! It is believed that this formula is capable of predicting the future of the company with a result of up to 80%.
What does a negative current ratio show?
In the literal sense, the value of the indicator cannot be a negative number - it can be small down to one ten-thousandth. Progressive negative dynamics of the value indicate the following:
- incorrect financial policy of the company and distribution of funds;
- oversaturation of obligations to creditors;
- large volume of unsold products;
- about excessive investment;
- the presence of a large number of debts outstanding to the company.
- probable imminent bankruptcy.
Methods for assessing financial condition using the current liquidity indicator
Basic assessment methods involving the coefficient:
- Selezneva-Ionova model. The methodology is aimed at comparing actual indicators with the standard, identifying the profitability of assets in terms of their net income, as well as an overall assessment of the company's management.
- Saifullin-Kadykov model. Similar to the previous one, it may be true for analyzing the financial status of companies of various industries and sizes. The success of sales and turnover of your own budget is also calculated.
- Postyushkov's model. Suitable for assessing the prediction of the ruin of an enterprise with a prediction range of up to six months.
Current ratio: current issues
Answer: All information is taken from the company’s annual financial report and accounting documents.
Question No. 2: Should we focus on the all-Russian norms of the current liquidity ratio?
Answer: Only for information ownership. For each industry, depending on the subject of the Russian Federation where it operates, k indicators vary greatly.
Question No. 3: For whom should k total liquidity be calculated first?
Answer: This information is useful for the head of the enterprise to have, and it may also be required by your creditors and investors.
Question No. 4: If my calculated ratio is high - more than two, does that mean my business is moving in the right direction?
Answer: Unfortunately, this is not true. High indicators indicate that working capital is not actually working.
Question #5: Can the current ratio be negative?
Answer: No, even its formula does not suggest this. Maybe there is a negative trend or a negative result – less than 1.5.